


Market and Price Determination Including Forms of Market
1. What is a Market in Economics?
In economics, a market refers not to a physical place but to a system or arrangement where buyers and sellers interact to exchange goods and services, directly or through intermediaries.
Example: The stock market, vegetable market, and online platforms like Amazon are all markets.
2. Price Determination: The Basics
Price is determined by interaction of demand and supply.
Equilibrium Price:
It is the price at which quantity demanded equals quantity supplied.
Equilibrium Quantity:
It is the quantity bought and sold at the equilibrium price.
Graph: Price Determination
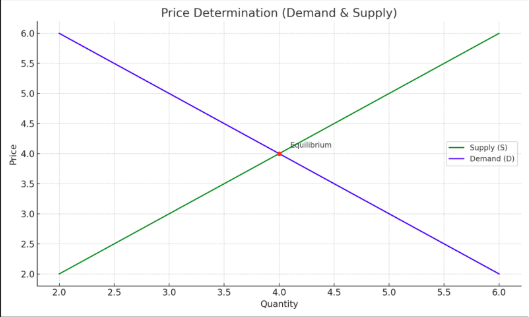
The point where the demand curve (downward sloping) and supply curve (upward sloping) intersect is the equilibrium.
Left of this point: shortage (demand > supply)
Right of this point: surplus (supply > demand)
Example: If mangoes are in season and supply is high, prices drop. If demand increases for mangoes in off-season, prices rise.
3. Types/Forms of Market
| Market Type | No. of Sellers | Nature of Product | Price Control | Entry/Exit |
|---|---|---|---|---|
| Perfect Competition | Many | Homogeneous | No control | Free entry/exit |
| Monopoly | One | Unique | High control | Barriers exist |
| Monopolistic Competition | Many | Differentiated | Some control | Easy entry/exit |
| Oligopoly | Few | Identical/Differentiated | Some control | Barriers exist |
Perfect Competition
Large number of buyers and sellers, homogeneous products, price taker firms.
Monopoly
Single seller, unique product, high barriers to entry, price maker.
Monopolistic Competition
Many sellers, product differentiation, some control over price.
Oligopoly
Few sellers, interdependence, price rigidity common.
4. Factors Influencing Price Determination
Demand Side Factors:
• Consumer preferences
• Income levels
• Price of substitutes
• Future expectations
Supply Side Factors:
• Cost of production
• Input prices
• Technology
• Government policies
5. Shifts in Demand and Supply
Increase in Demand → Price rises
Increase in Supply → Price falls
Summary Table
| Concept | Meaning | Example |
|---|---|---|
| Equilibrium Price | Price at which D = S | ₹30 per kg for tomatoes |
| Perfect Competition | Many sellers, same product | Wheat in mandi |
| Monopoly | One seller, unique product | Indian Railways |
| Monopolistic Competition | Many sellers, brand differentiation | Toothpaste market |
| Oligopoly | Few sellers, price rigidity | Car or telecom sector |
Graph: Price Determination
This graph shows how equilibrium price and quantity are determined by the intersection of demand and supply curves.
Graph: Monopoly Market
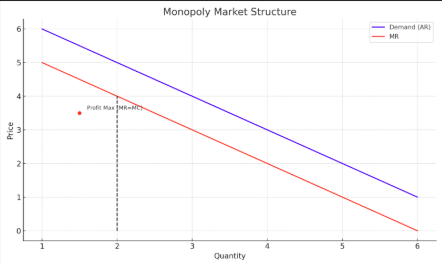
The Monopoly graph shows downward-sloping demand and MR curve. Profit is maximized where MR = MC.
Graph: Monopolistic Competition
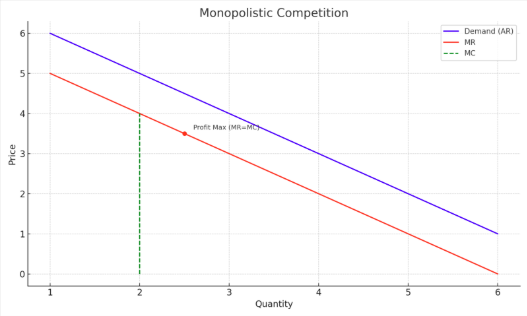
This graph illustrates product differentiation and short-run equilibrium in monopolistic competition.
Graph: Oligopoly (Kinked Demand Curve)
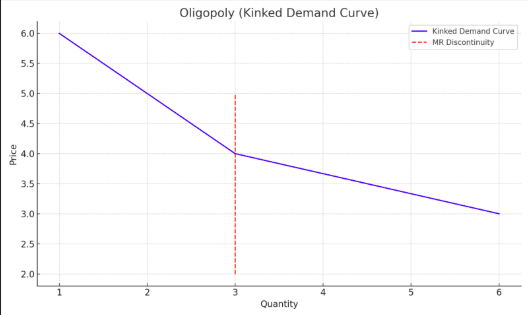
The kinked demand curve shows price rigidity. Firms do not increase prices fearing loss of customers.
Graph: Shift in Demand Curve
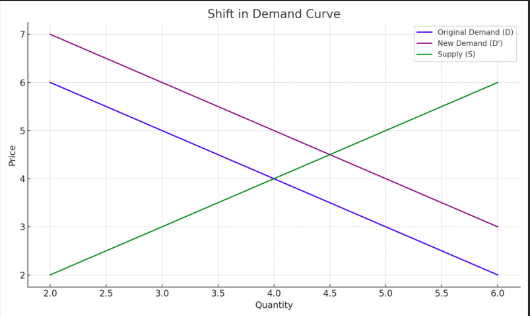
This graph shows an increase in demand from D to D', leading to a rise in equilibrium price and quantity.
Copyright © 2026 Manupatra. All Rights Reserved.


 Toll Free No : 1-800-103-3550
 +91-120-4014521